CROCODILE-CESM-DART Tutorial
The CROCODILE-CESM-DART tutorial walks through building a regional ocean data assimilation experiment for Hawaii using DART with MOM6 in CESM3. It was developed as part of the CROCODILE project and is part of the CrocoGallery collection of tutorials.
The tutorial is a series of three Jupyter notebooks, designed to be worked through in order. Each notebook builds on the work from the previous one.
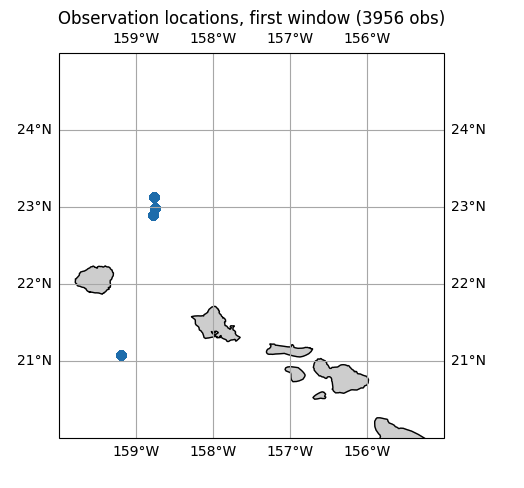
1. Working with Real Observations
Turn real Argo profiles from CrocoLake into DART obs_seq files with dartobsgen.
You leave with a directory of observations ready to assimilate.
2. Synthetic Observations
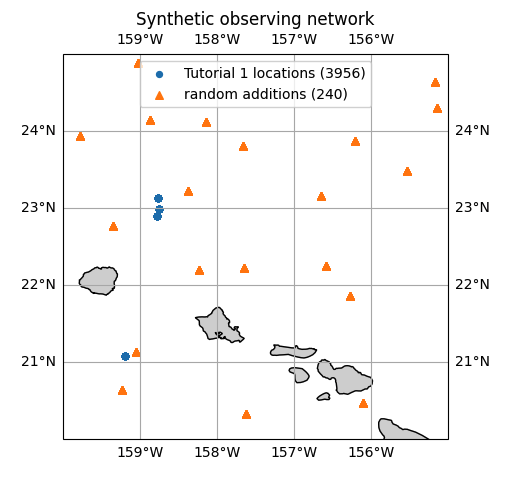
Sample a model state with DART’s perfect_model_obs at the Tutorial 1 locations plus random
ones you design. You leave with a synthetic observing network for an
Observing System Simulation Experiment (OSSE).
3. Cycling DART–CESM
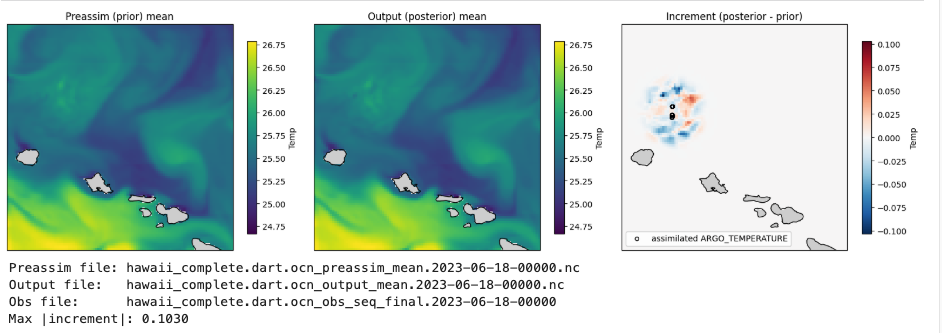
Build a multi-instance regional MOM6 ensemble in CESM, assimilate your observations every 24 hours, and diagnose the results. You leave with a running data assimilation experiment.
Getting started
The notebooks are written to run on NSF NCAR’s Derecho (or an equivalent HPC system) using the CROCODILE workspace. You will also need access to the CrocoLake observation database and a DART clone. See the “Before you start” section of the first notebook for details.
The notebooks are available in the
CrocoGallery repository in the dart directory.