The CAM6+DART Reanalysis for Earth System Science
The Earth system can be viewed as distinct but connected components: atmosphere, land, ocean, cryosphere, biosphere, et cetera (Fig. 1). Data assimilation can help us create the best available representation of the state of Earth, but it requires relevant observations and a forecast model which represents all of the components of interest.
Earth system components interact in many ways at the interfaces between them.
NCAR’s Community Earth System Model (CESM) can run forecasts with a flexible choice of “active” components, in which the component model state evolves according to equations, and “data” components, in which the component state is read from a data file. For example, to generate atmospheric forecasts, the configuration could have active atmosphere and land components, but simply read sea surface temperatures (SSTs) from data files, instead of running an expensive, active, ocean component to generate SSTs. CESM has been developed at NCAR for decades, and has evolved to work effectively with DART through the efforts of the CESM Software Engineering Group (M. Vertenstein, S. Goldhaber, J. Edwards) and R. Montuoro.
Data assimilation has been extensively applied to the atmosphere for decades, but not to the surface components until more recently. One hurdle has been that the surface components tend to be more slowly varying, so they require atmospheric forcing over long time spans. It’s expensive to run an atmospheric model, and many experiments may require the same atmospheric forcing, which would be wasteful to regenerate each time. Further, research shows that an ensemble of surface models requires an ensemble of forcing from the atmosphere in order to maintain the necessary ensemble spread (Fig. 2).
So the cost is multiplied by the size of the ensemble. There are thus compelling reasons to generate an ensemble of atmospheric forcing once and archive it for repeated use.
To satisfy this need the DART team has generated a “reanalysis” spanning years 2011-2020 using DART, CESM (v2.1) with an active atmospheric model component, the Community Atmosphere Model version 6(CAM6), and several million observations per day. This reanalysis shares characteristics with widely used reanalyses, such as ERA5 (Hersbach, et al., 2020), JRA55 (Kobayashi, et al., 2015), and MERRA-2 (Gelaro, et al., 2017). The primary goals of those are to provide a high resolution (spatial and temporal) description of the atmosphere using as many observations as provide useful information. The CAM6+DART Reanalysis is more focused on creating a larger (80-member) ensemble of fluxes and forcing at the surface, representing the actual weather, while using fewer observations and lower resolution. The assimilation is purely ensemble based, as opposed to the variational methods used in the other reanalyses, and it employed state-of-the-art algorithms such as:
- Enhanced Adaptive Inflation (Gharamti, 2018),
- Sampling Error Correction (Anderson, 2012),
- explicitly-tuned, horizontal and vertical observation localization.
The ensemble automatically provides a representation of the uncertainty as a function of location, time, and variable (Fig. 3).
The results are archived with frequencies ranging from hourly to 6-hourly, depending on the variable. They are packaged into useful units and freely available from NCAR’s Research Data Archive.
Another distinction from other reanalyses is the time span. The CAM6+DART Reanalysis spans 2011-2020, while the others span multiple decades up to the present. There is also a CAM4+DART Reanalysis which spans 1998-2011 and provides similar forcing files. The improvements in the CAM6 version from the CAM4 version include:
- 1-degree, 32-level CAM6 instead of 2-degree, 26-level CAM4
- high res SST forcing; 1/4 degree daily instead of 2 degree monthly
- improved inflation algorithm (Gharamti, 2018).
- careful tuning of assimilation parameters and choice of algorithms.
- addition of AIRS T retrievals and GPS-RO (unavailable from the first half of the CAM4 Reanalysis); the quality and number of the cloud drift wind observations improved dramatically in the later years of the CAM6 Reanalysis.
- more complete set of forcing variables were archived, enabling more CESM components to use them.
The Reanalysis generated other datasets, which may be useful for other research:
- Ensembles of real-world initial conditions for some CESM configurations.
- Time series of CESM+DART’s “best estimate” of the atmospheric state, which can be compared against other forecasts (Fig. 4).
- Diagnostics which display strengths and biases of the Reanalysis and the observations.
- ~10 billion “labeled” observations for use in machine learning or artificial intelligence research.
A very detailed description is available in A new CAM6+DART reanalysis with surface forcing from CAM6 to other CESM models (Raeder et al. 2021).
This reanalysis required 17 million core hours on NCAR’s Cheyenne supercomputer and resulted in 120 Tbytes of archived data. Crucial resources to complete this project came from NCAR’s Computational and Information Systems Lab Strategic Capability project NCIS0006.
D. Hart adapted Cheyenne’s queues to enable efficient workflow. B. Matthews and B. Dobbins provided valuable efficiency advice.
The DART infrastructure has been developed over 20 years by J. Anderson, T. Hoar, N. Collins, H. Kershaw, K. Raeder, M. Gharamti, and a large community of contributors.
Example studies using the CAM6 Reanalysis
Here are glimpses into how these products have been used:
- Surface forcing in “Exploring Non-Gaussian Sea Ice Characteristics via Observing System Simulation Experiments” (Riedel and Anderson, 2023; submitted to The Cryosphere). This study is a test of DART’s new Quantile Conserving Filter (Anderson, 2022).
- Surface forcing in “Assimilating leaf area index and aboveground biomass into CLM to constrain the carbon dynamics in the Arctic and Boreal Region” (Huo, et al., 2023; submitted to JGR: Biogeosciences). This study uses a spatial subset of the forcing data.
- Surface forcing an 80 member, eddy-resolving, POP ensemble to generate a global ocean reanalysis spanning 2011-2015, that encompasses the termination of a La Niña in 2012, the transition of PDO from its cool to warm phase in 2014 and the onset of an El Niño in 2015.
References
- Anderson, J. L., 2012: Localization and Sampling Error Correction in Ensemble Kalman Filter Data Assimilation. Monthly Weather Review, 140, 2359–2371, https://doi.org/10.1175/MWR-D-11-00013.1.
- Anderson, J. L., 2022: A Quantile-Conserving Ensemble Filter Framework. Part I: Updating an Observed Variable. Monthly Weather Review, 150, 1061–1074, https://doi.org/10.1175/MWR-D-21-0229.1.
- El Gharamti, M., 2018: Enhanced Adaptive Inflation Algorithm for Ensemble Filters. Monthly Weather Review, 146, 623–640, https://doi.org/10.1175/MWR-D-17-0187.1.
- Gelaro, R., and Coauthors, 2017: The Modern-Era Retrospective Analysis for Research and Applications, Version 2 (MERRA-2). Journal of Climate, 30, 5419–5454, https://doi.org/10.1175/JCLI-D-16-0758.1.
- Huo, X., et al. Assimilating leaf area index and aboveground biomass into CLM to constrain the carbon dynamics in the Arctic and Boreal Region (submitted to JGR: Biogeosciences, 2023).
- Hersbach, H., and Coauthors, 2020: The ERA5 global reanalysis. Quarterly Journal of the Royal Meteorological Society, 146, 1999–2049, https://doi.org/10.1002/qj.3803.
- Kobayashi, S., and Coauthors, 2015: The JRA-55 Reanalysis: General Specifications and Basic Characteristics. Journal of the Meteorological Society of Japan. Ser. II, 93, 5–48, https://doi.org/10.2151/jmsj.2015-001.
- Raeder, K., T. J. Hoar, M. El Gharamti, B. K. Johnson, N. Collins, J. L. Anderson, J. Steward, and M. Coady, 2021: A new CAM6 + DART reanalysis with surface forcing from CAM6 to other CESM models. Scientific Reports, 11, 16384, https://doi.org/10.1038/s41598-021-92927-0
- Riedel, C. and Anderson, J.L. Exploring Non-Gaussian Sea Ice Characteristics via Observing System Simulation Experiments (submitted to The Cryosphere, 2023).

Figure 1: Earth system components interact in many ways at the interfaces between them.
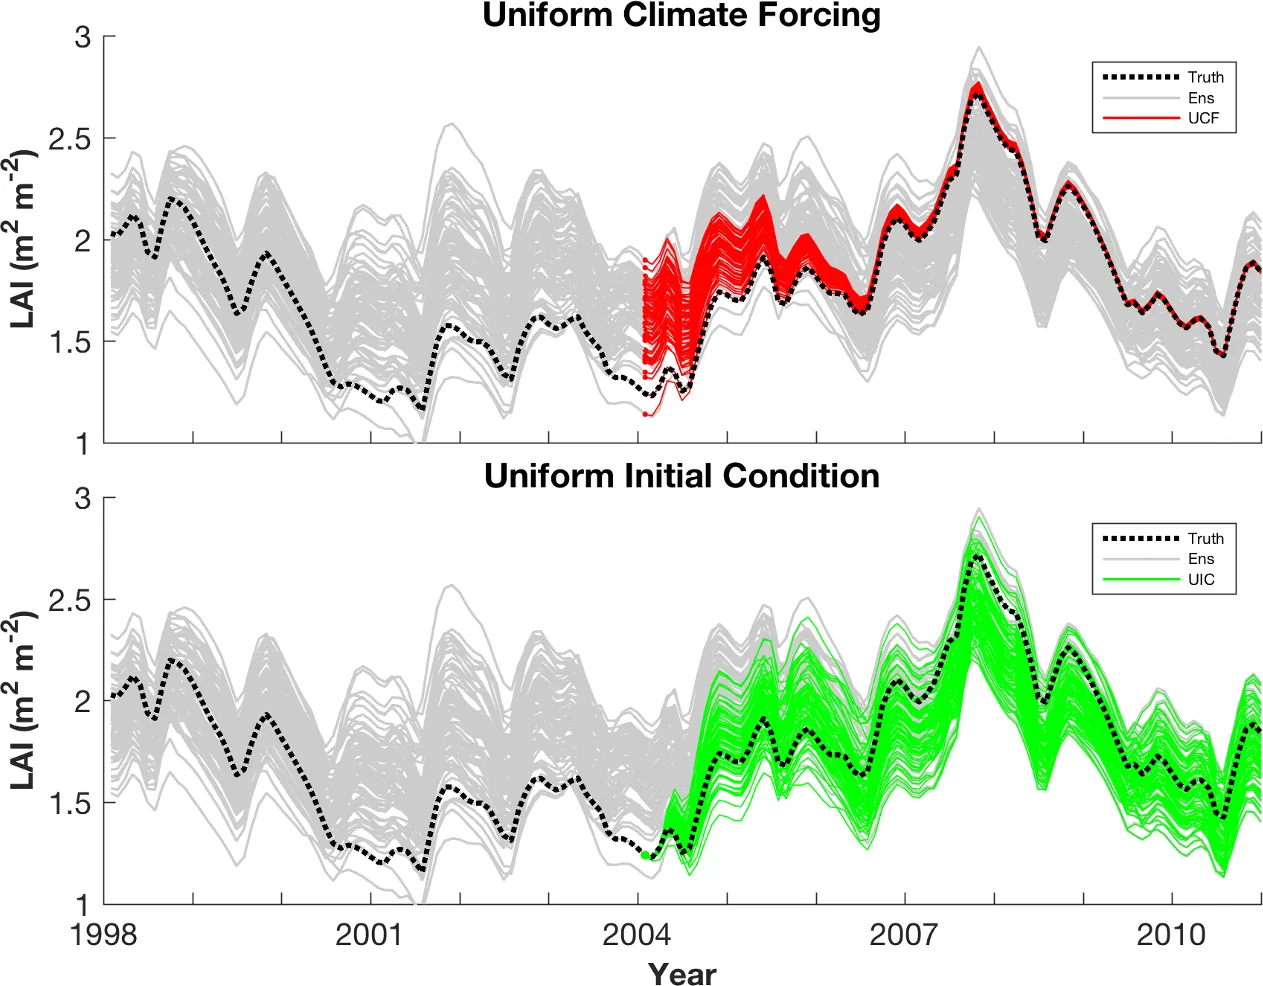
Figure 2: A single atmospheric forcing allows an ensemble to collapse (top). Multiple atmospheric forcings cause the spread to increase (bottom). Picture courtesy of A. Fox.
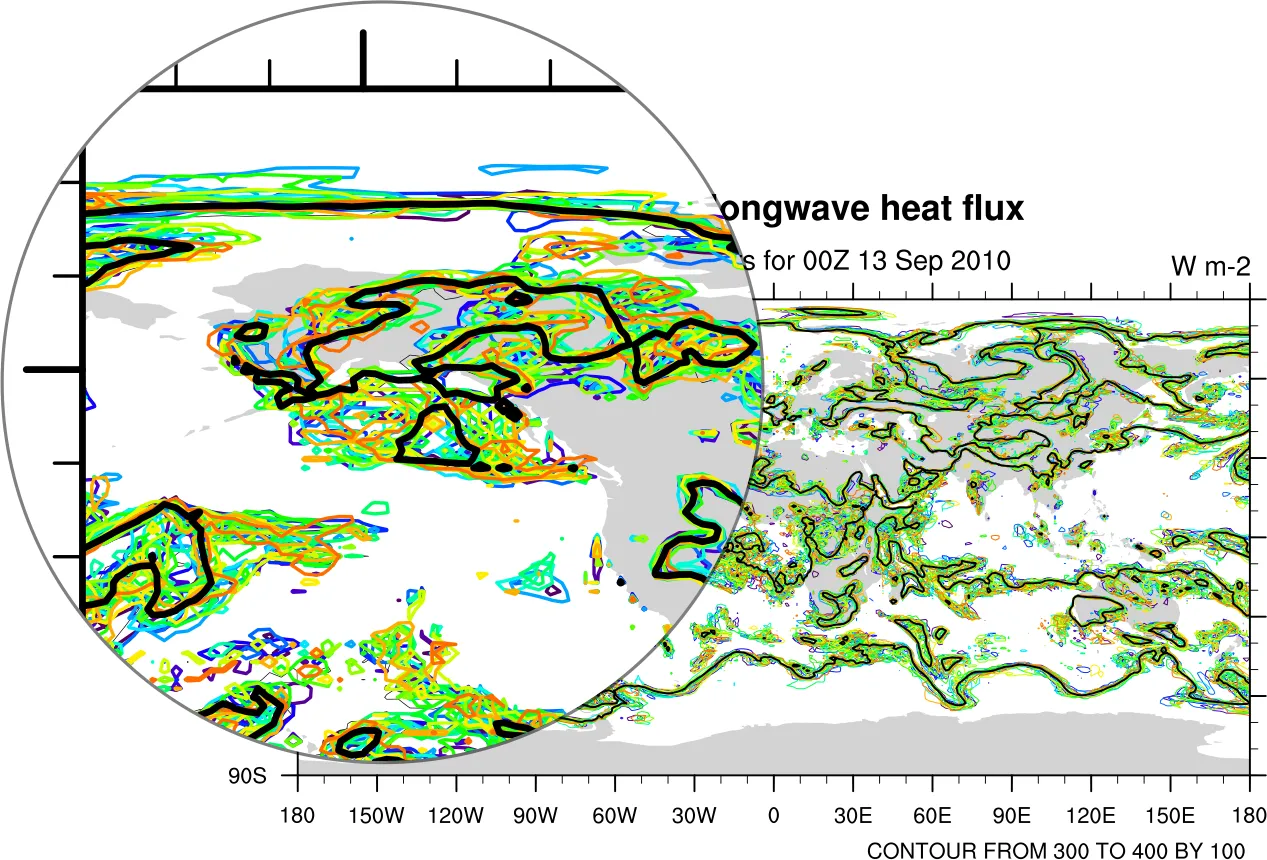
Figure 3: The downward longwave heat flux from 20 (of 80) ensemble members (various colors) and the ensemble mean (black).
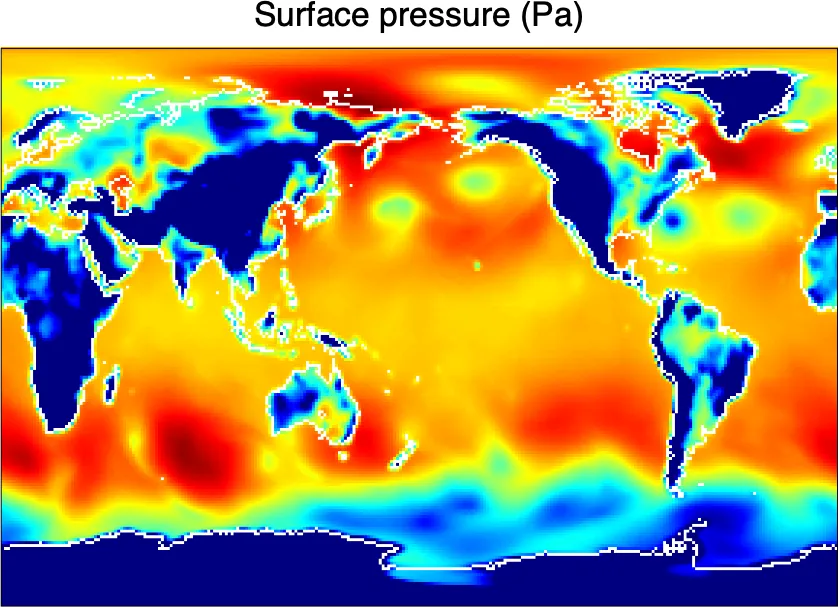
Figure 4: A 1-degree resolution model doesn't generate great hurricanes by itself, but here's hurricane Sandy shortly before landfall 0Z 10/29/2012 in the analysis, ensemble mean, surface pressure. Here's a comparison of central pressures: National Hurricane Center 'best track' = 950 hPa; Knaff-Zehr-Courtney pressure-wind relationship = 959 hPa; CAM6+DART ensemble mean and spread = 956.6 +/- 1.7 hPa.